This practical connects the lectures and practicals covered in the course as they would work together for a typical data analysis with data import, transformation, summarizing and plotting.
Atmospheric carbon dioxide
\(CO_2\)
Carbon dioxide, CO2 is as its name says, an oxide. Meaning, once in the atmosphere is it extremely stable and will remain there for thousands of years. Two main carbon sinks exist: forest, mainly trees that incorporate the carbon for their growth and oceans. The latter have absorbed approximately half of what humans have produce by burning oil, not without consequences. Oceans are getting warmer, making CO2 solubility weaker and diminishes the pH. This acidification already killed half of the animals building coral reef (91% as in 2022) and calcifying organisms. CO2, like methane is a greenhouse gas, absorbing and radiating infrared thermal energy leading to heat being trapped close to the ground. It is worth saying that the first scientist to discover the link between CO2 and heat trap was a woman Eunice Newton Foote as early as 1856. French version of the Wikipedia page is more in line with the Smithsonian article: she was not allowed to present her work because of her gender.
Find out how long carbon dioxide can last in our atmosphere and why it matters to look at cumulative emissions
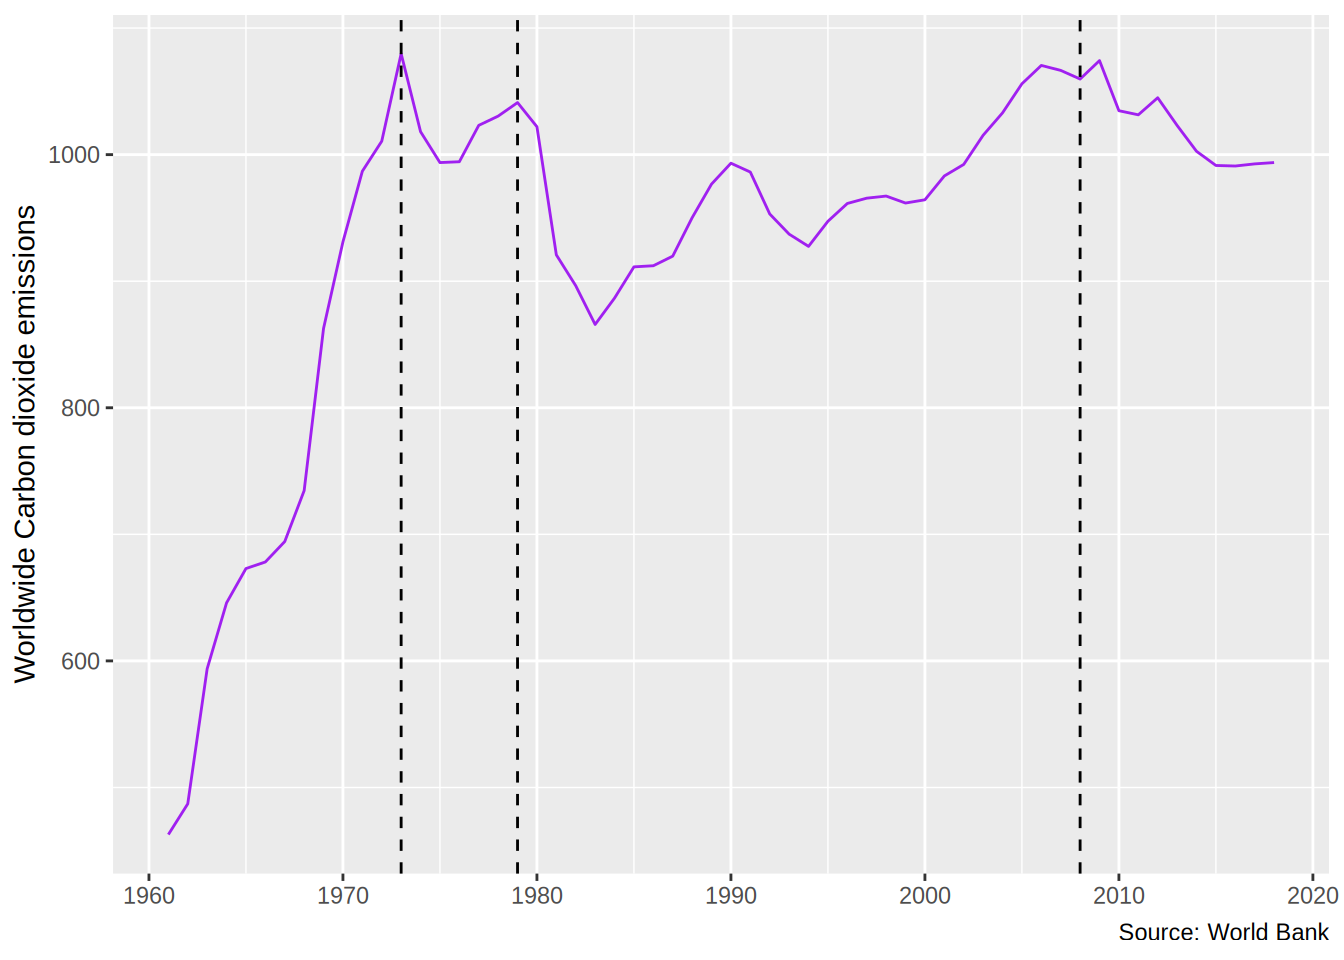
Cumulative carbon dioxide emissions
Due to extreme long time CO2 remains in the atmosphere, looking at yearly emissions is of little interest. Especially since this is used by rich countries who got rid of most of their industry to justify little efforts. What matters is the cumulative emissions. For this, we will look at the data from the World Bank. Unfortunately, they don’t provide the 1960 - 2020 but 1990-2021, so please use my local copy linked below.
Warning in f(names[[col]]): NAs introduced by coercion
cum_co2_long
# A tibble: 16,492 × 3
   `Country Name`  year co2_emissions_mt_per_cap
   <chr>          <int>                    <dbl>
 1 Aruba           1960                       NA
 2 Aruba           1961                       NA
 3 Aruba           1962                       NA
 4 Aruba           1963                       NA
 5 Aruba           1964                       NA
 6 Aruba           1965                       NA
 7 Aruba           1966                       NA
 8 Aruba           1967                       NA
 9 Aruba           1968                       NA
10 Aruba           1969                       NA
# ℹ 16,482 more rows
Cleanup by removing the missing values and the year 66
Tip
The first year is 1960, a coherent filtering on the year column. For removing missing values of CO2, drop_na() is a good pick
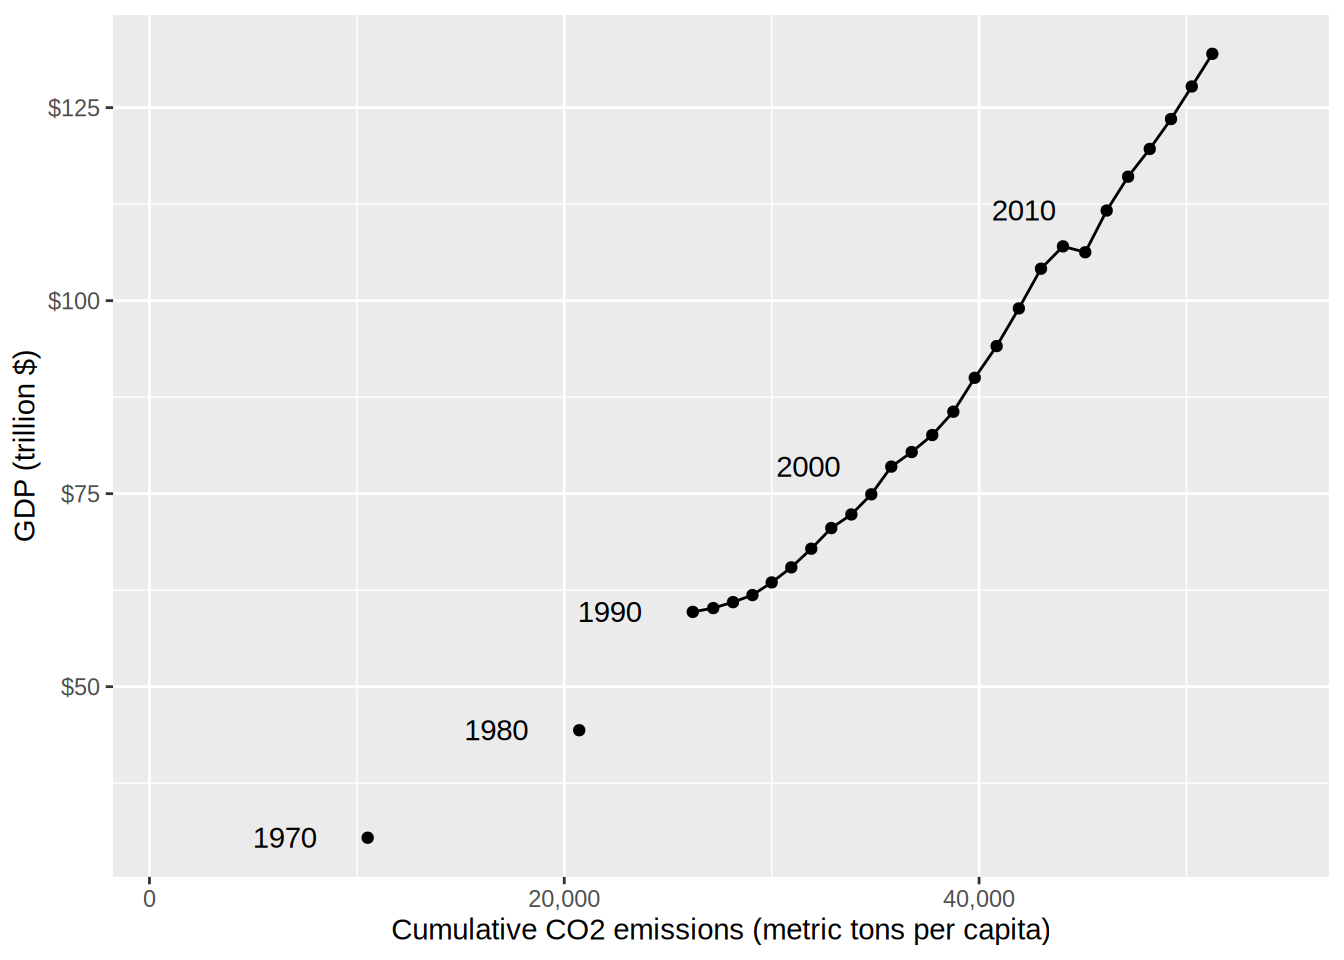
Burning fossils is what make economy working. Any crisis comes usually after a peak of energy prices. Even the 2008 crisis is partly due to this price increase. The US reacted by from 2010 firing up the production of shale oil.
GDP is the main economic indicator and the only target for most countries since WWII. And this despite a poor indicator (accidents, disasters increase GDP) it is the target.
However, one can argue that the emissions data start only in 1960 and are in per-capita units.
Let’s explore with another dataset from the famous Our World in Data organisation
Download and open the CSV CO2 file, assign name owid_co2
Tip
This file comes already in a data format you can use straight away. But there are missing values in columns, so pay attention to use the argument na.rm = TRUE in your sums.
# A tibble: 29 × 3
   country  year cumulative_co2
   <chr>   <dbl>          <dbl>
 1 World    1995        923887.
 2 World    1996        948146.
 3 World    1997        972548.
 4 World    1998        996851.
 5 World    1999       1021705
 6 World    2000       1047216.
 7 World    2001       1072922.
 8 World    2002       1099199.
 9 World    2003       1126868.
10 World    2004       1155501.
# ℹ 19 more rows
We find 1993 this time. Previous 1960 emissions were tiny, Worldwide population almost tripled between 1960 and today and energy usage in Western countries just exploded.
Display the top 10 Carbon dioxide countries emitters of all time and comment
Tip
The Our World in Data added the calculations for continents and world inside country. to select only individual countries, select only iso_code that are 3 characters long.
There is too much of fossil energy left to make our climate livable. The carbon dioxide concentration has never been that high as today since 800,000 years. Thus, all the humankind history has lived in lower concentrations, the new era is then an unknown territory. However, as seen in Delannoy et al. 2021, in Applied Energy there is not enough fossil for continuing our current life style, and for lower income countries to reach it.